MU | Century Financial Limited

Introduction
Sovereign debt has reached levels that would have looked implausible a generation ago. Government debt rose to around 93% of GDP in 2025. This kind of risk rarely announces itself. It shows up in what governments can no longer do.
Who Owes the Most
Twenty-three countries now owe more than they produce in a year. The largest ratios do not always belong to the economies most associated with fiscal strain.
| Country | Debt, % of GDP (2026) |
|---|---|
| Japan | 204.4% |
| Italy | 138.4% |
| United States | 125.8% |
| France | 118.4% |
| China | 106.9% |
| United Kingdom | 103.6% |
Source: IMF World Economic Outlook, April 2026
Why the Same Ratio Means Different Things
A debt ratio measures size. It says nothing about who holds the debt, in which currency, or who steps in when buyers hesitate, and those three details determine how much pressure any given number carries.
- Japan owes mostly to itself, through domestic institutions and its central bank
- The US borrows in the reserve currency, so demand is partly structural
- Italy and France borrow in euros without controlling the issuing central bank
- Emerging markets borrowing in dollars owe money they cannot create
Japan, the Long-Running Exception
For three decades, Japan demonstrated that very high sovereign debt need not produce high yields, largely because the Bank of Japan was buying, at one point holding over half of all outstanding government bonds. That support is now being withdrawn as policy normalizes. The 30-year yield hit a record 3.97% in August 2026, and the 10-year reached its highest since 1996, even while the IMF projects Japan’s debt ratio to fall roughly 14 percentage points on strong nominal growth. The debt improved. The buyer changed.
The Refinancing Loop
Sovereign debt becomes self-reinforcing through a one-way sequence.
- Rates rise, and maturing debt refinances at a higher cost
- Interest payments grow, widening the deficit
- A wider deficit requires more issuance
- More supply needs more buyers, which can lift yields again
The US shows the loop running. The CBO projects net interest near $1.0 trillion in fiscal 2026. Globally, interest payments climbed from 2% to nearly 3% of GDP in four years. None of these steps is automatic, since stronger growth or falling rates can interrupt the cycle, so this describes a pressure rather than a destination.
Where It Reaches Markets
Government balance sheets rarely appear on a trading screen, but their effects arrive through several doors at once.
- Long-dated bond yields, through supply and term premium
- Equity valuations, through higher discount rates on future earnings
- Currencies, where fiscal credibility is continuously priced
- Gold, which draws attention as an asset no government issues
The Risk Is Room, Not Collapse
High sovereign debt seldom produces a single dramatic moment. Its more dependable effect is the narrowing of fiscal space, meaning the capacity to borrow heavily in response to a recession, a conflict or a banking shock. A government entering a downturn at 60% of GDP has options that one entering at 125% may not. That is what makes the risk quiet—it appears in what becomes difficult later, not in what breaks today.
One Story, Four Markets
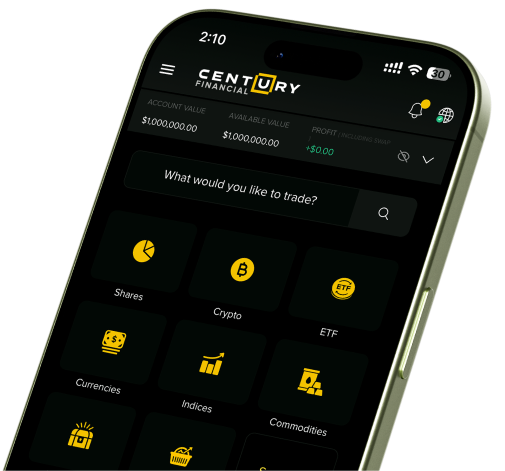
A debt story rarely stays in the bond market. It starts in government paper, moves through the currency, then surfaces in equity valuations and gold. Treasuries sit alongside currencies, indices, commodities, and shares on the Century Trader App and MT5, letting you follow the source and its consequences together, not in separate places.
Century Financial has operated for more than 35 years, spanning the eurozone debt crisis and the Japanese experiment that preceded it, and is regulated by the Financial Services Commission (FSC) in Mauritius.
A Balance Sheet Measured in Decades
Record borrowing is several stories rather than one. Japan shows that a very high ratio can hold for decades when domestic buyers absorb it, and how conditions shift once a central bank steps back. The US shows that reserve-currency status softens the pressure without canceling the interest bill. The eurozone shows what changes when a government borrows in a currency it does not issue. The common thread is the refinancing loop and the shrinking margin for response when something else goes wrong.
These pressures build slowly and publish on a schedule, through budget statements, bond auctions, and central bank balance sheets, which makes them unusually trackable for anyone willing to look. With treasuries, currencies, gold, and equities available in a single Century Financial account, you can watch the debt story and its market echoes from one screen. A demo account is a straightforward way to start.
FAQs
Disclaimer: CFDs are complex instruments and come with a high risk of losing money rapidly due to leverage. 74–89% of retail investor accounts lose money when trading CFDs. You should consider whether you understand how CFDs work and whether you can afford to take the high risk of losing your money. Past performance is not indicative of future results. This content is for informational purposes only and does not constitute investment advice or a recommendation to buy, sell, or hold any financial instrument. Century Financial does not guarantee the accuracy, completeness, or timeliness of this information and accepts no liability for any loss arising from its use.