MU | Century Financial Limited

Introduction
Despite its perceived complexities, trading can become easy to understand for people willing to learn. This How to Trade series, in four weekly parts—Week 1, Week 2, Week 3, and Week 4—covers ideas and aspects for anyone who wants to become a trader.
Week three covers the trading chart: what each candle shows, what happens when you change the timeframe, how support and resistance levels work, how to tell a trend from a range, what indicators actually measure, and what a chart sometimes misses.
What One Candle Shows
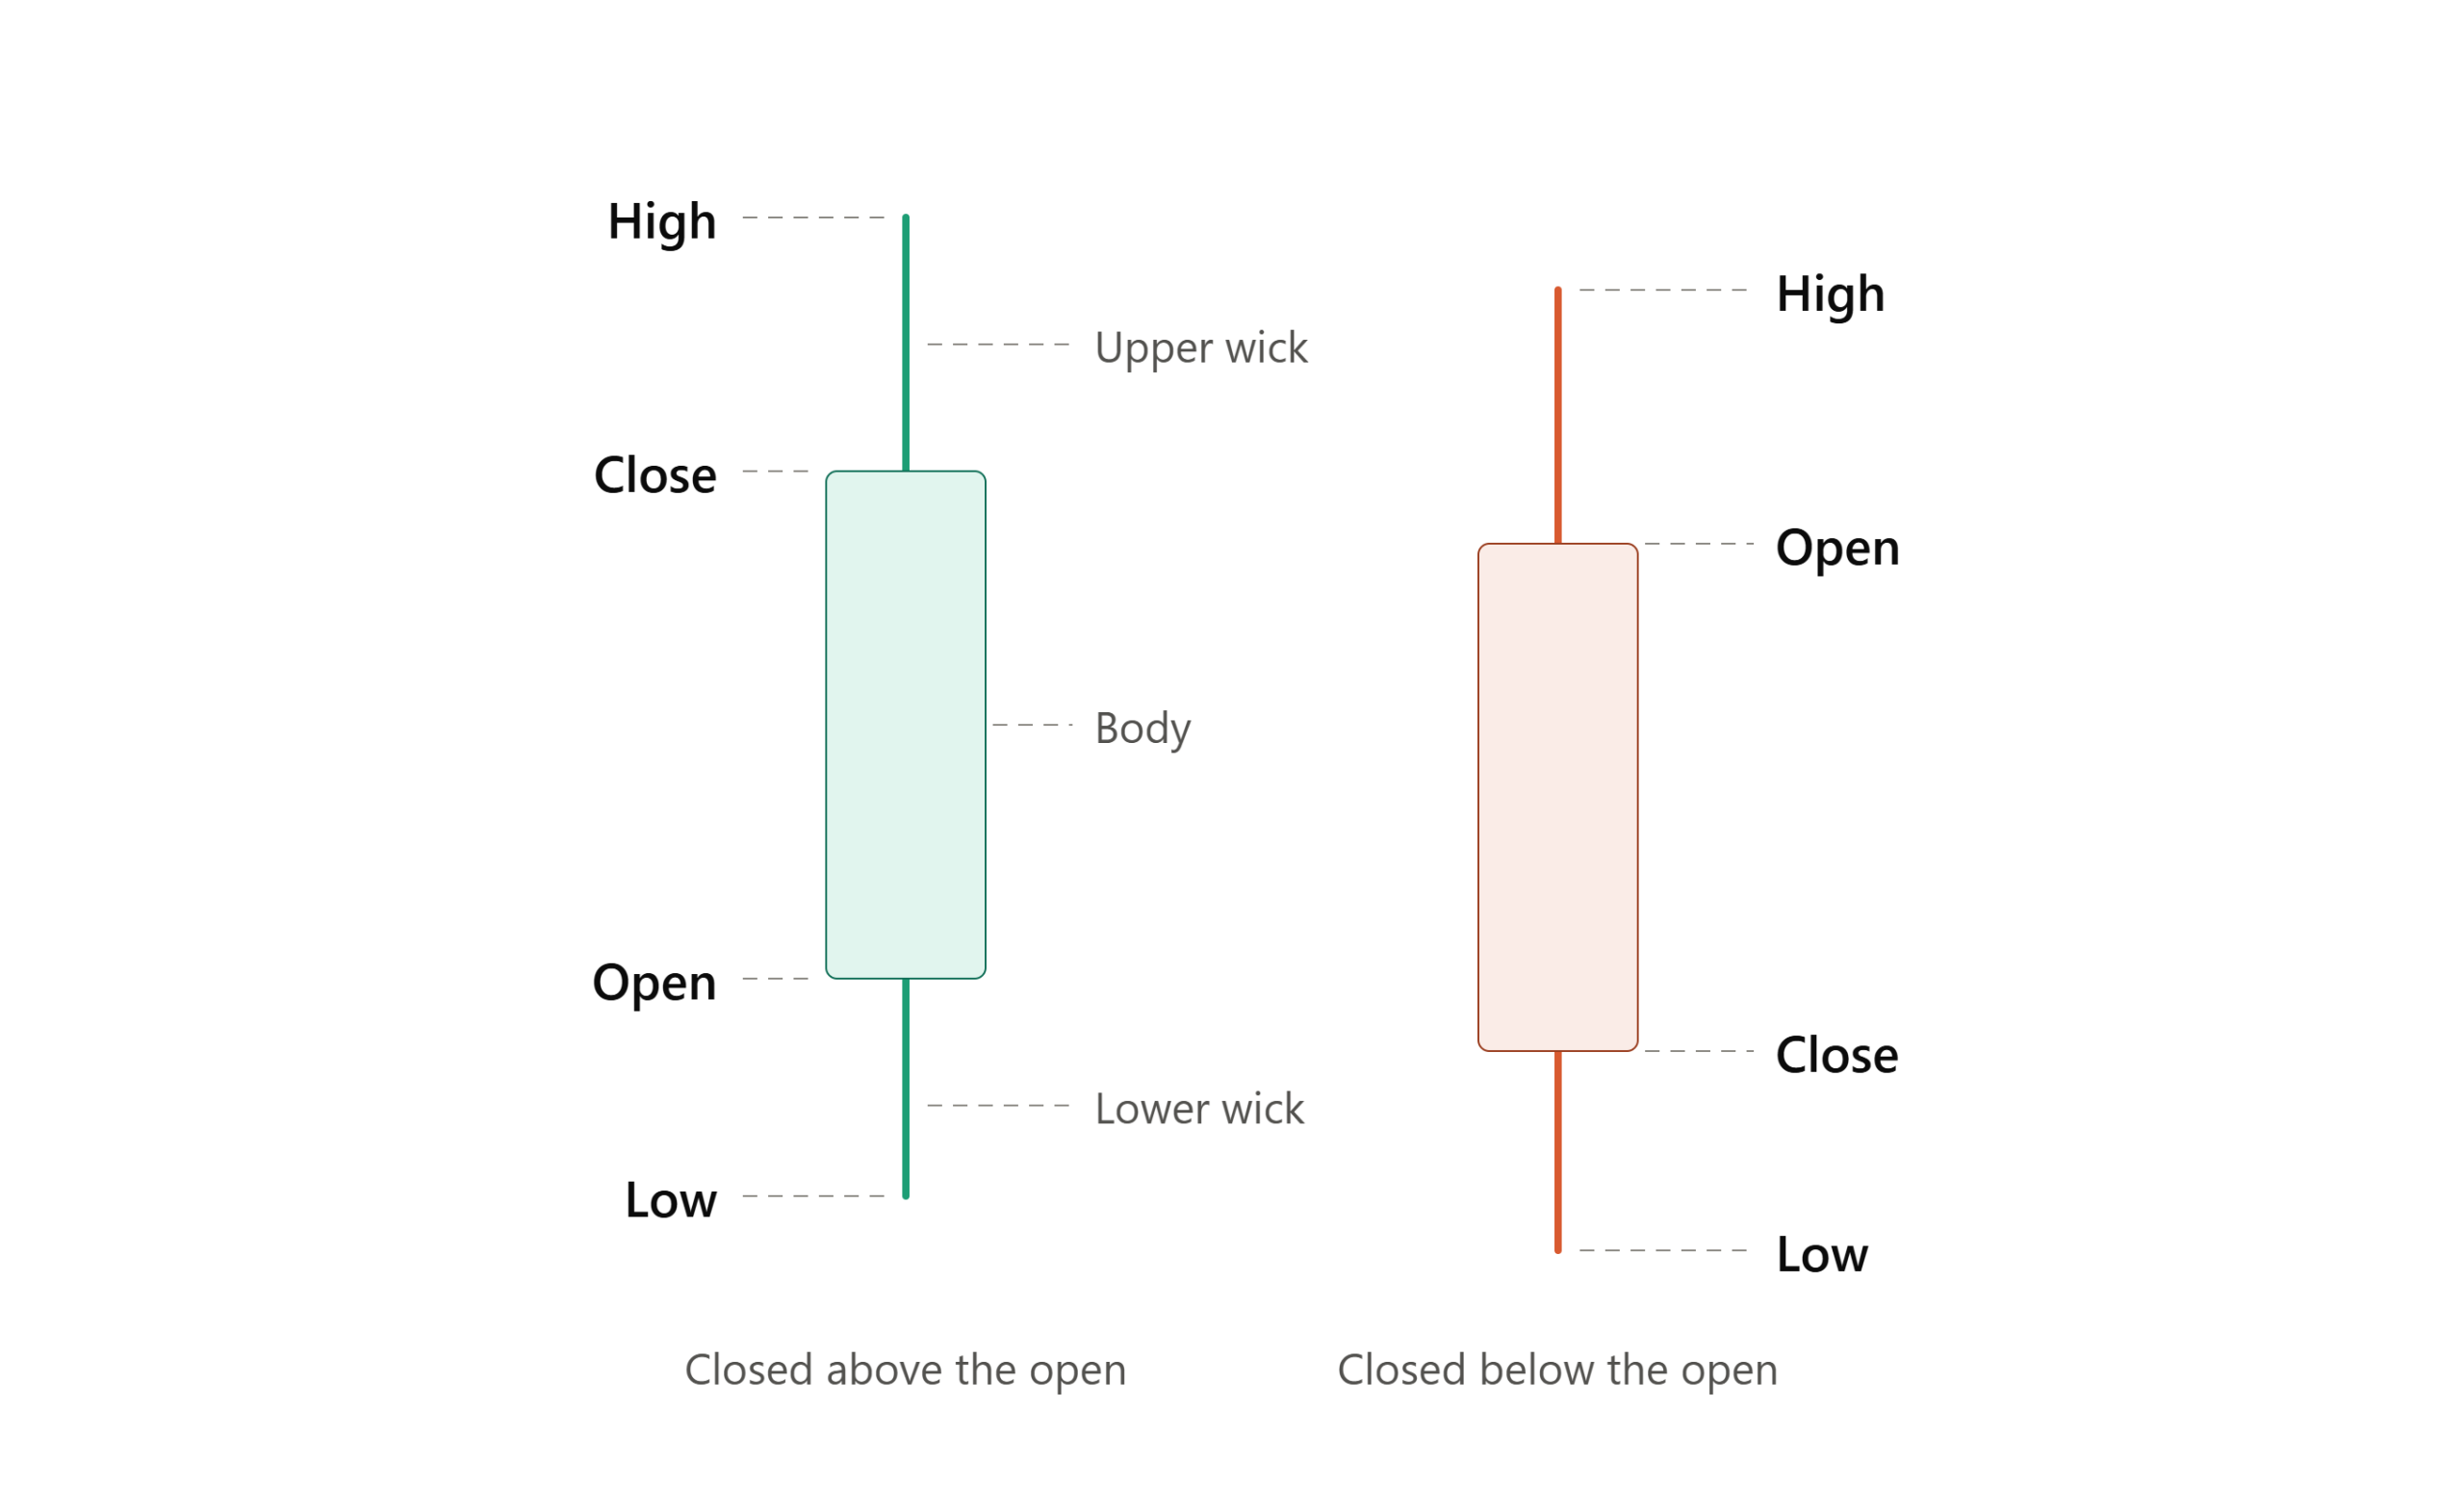
Each candle on a chart contains four prices. Where the period opened, the highest price it reached, the lowest price it reached, and where it closed. The thick part is the body, running between the open and the close. The thin lines above and below are wicks, and they mark the extremes.
A long upper wick means price rose during the period and then came back down before the close. Buyers pushed it up; sellers pushed it back. All interpretations are variations of this insight.
What Changing the Timeframe Does
One candle covers one unit of time. On a daily chart, each candle is one full day; on a one-hour chart, each candle is one hour. A currency pair runs around the clock on weekdays, so a day is roughly 24 hourly candles. A share listed in New York trades a six-and-a-half-hour session, so the same day is seven. Though the price history is identical for assets regardless of chart type, what changes is how much detail you see and how much noise comes with it.
Test it out by opening the same instrument on a daily and a 15-minute chart. A move that looks like a clean rise on the daily often contains multiple reversals on the shorter timeframe. Traders using each will describe the market differently, and neither is wrong.
Levels Where Price Has Stopped Before
Support and resistance are recurring terms in the markets, whether in conversations about trends or strategies.
What is Support
Support is a price level where prices have repeatedly stopped and turned back up, keeping the prevailing trend intact. So in a bullish market, support is a level at which a given asset's price has dropped to and picked up from over and over again.
What is Resistance
Resistance is a level where rising prices have repeatedly stalled, capping a trend's extent. At a resistance level, an instrument in a bearish trend falls to a certain price, but it keeps getting pushed up, stopping the trend from deepening.
Why Support and Resistance Matter
Many people look at the same chart, notice the same level, and place orders around it. The level works partly because enough participants expect it to hold.
But these are zones, not exact lines, so the levels break regularly and price often overshoots slightly before reversing. A level holding four times says nothing about whether it’ll hold the fifth time.
Telling a Trend From a Range
A trend is a sequence. In an uptrend, each peak is higher than the last, and each dip is higher than the last. In a downtrend, both are lower than the last. When price makes neither, it is ranging, moving sideways between a rough ceiling and floor.
What Makes Trends Harder Than They Look
- A trend is identified from highs and lows that have already formed
- The same chart can trend on one timeframe and range on another
- Trends ending often only become clear afterwards
What Indicators Actually Measure
An indicator is a calculation run on price data and plotted on the chart. It adds nothing that wasn't already in the price, but it gives you a visual guide to trends that simple charts might not.
- Moving Average: The average closing price across a set number of periods, drawn as a line. A 50-day version adds the last 50 closes and divides by 50. It smooths price so direction is easier to see.
- RSI: Short for Relative Strength Index—it compares the size of recent gains against recent losses on a scale of 0 to 100. High readings mean recent upward moves have been large relative to downward ones.
- MACD: The gap between two moving averages of different lengths, plotted as a line. It shows whether the shorter average is pulling away from the longer one or closing back toward it.
- Bollinger Bands: A moving average with two lines plotted above and below it, set at a distance based on standard deviation. The bands widen when price moves more and narrow when it is quiet.
What a Chart Cannot Tell You
A chart records completed transactions. It holds no information about anything that has not happened yet. It does not know that earnings are announced tomorrow, or that a central bank meets on Thursday.
It also makes patterns look far more obvious in hindsight than they appear while forming, because the chart you are studying only shows the setups that completed. Every similar formation that failed and went nowhere is on the same chart, unmarked and unremembered. This is why week two was about risk and position sizing. A chart gives you a reason to act; it does not tell you how much to commit.
This Week's Output
By the end of week three, you should be able to do four things on any chart you open: Read a single candle and say what happened during that period. Switch between two timeframes and describe how the picture changes. Mark two or three levels where price has previously stopped. Explain what each indicator on your chart measures; that's the quickest way to tell whether it belongs there.
Looking at More Than One Chart
Chart reading improves by comparison. A currency pair, an index, and a share behave differently on the same timeframe, and the fastest way to see that is to have them open side by side.
Century Financial, under the regulation of the Financial Services Commission (FSC) in Mauritius, offers charting across currencies, indices, commodities, and shares through MT5 and the Century Trader, both. supporting multiple timeframes and the standard indicator set.
Reading Comes Before Predicting
Most chart education jumps straight to patterns with names and arrows pointing at past examples. If you can read a candle, deliberately change a timeframe, mark the levels that have mattered, and say what your indicators measure, you can work out most patterns yourself, and you will know why they are supposed to work.
Week four brings these pieces together into a written plan, covering entry rules, exit rules, and how to review what happened. Until then, the useful exercise is opening one chart a day and describing out loud what the last five candles did. It sounds basic,but it is also the skill every other chart technique sits on top of.
FAQs
The content in this blog, including any research, analysis, opinions, forecasts, or other information (collectively, "Information"), is provided by Century Financial Limited (the “Company”) for marketing, educational, and general informational purposes only. It should not be construed as investment advice, a recommendation, or a solicitation to buy or sell any financial instruments.
This Information may also be published across various channels, including Company’s website, third-party platforms, newsletters, marketing materials, emails, social media, messaging apps, webinars, and other communications. While the Company strives for accuracy, we do not guarantee the completeness, reliability, or timeliness of any content. Any decisions made based on this Information are at your own risk. The Company accepts no liability for any loss or damage arising from its use.
Trading in financial products involves significant risk and may not be suitable for all investors. Please ensure you fully understand the risks and seek independent professional advice if necessary.
The Company is licensed and regulated by the Financial Services Commission (FSC) of Mauritius as an Investment Dealer (Full Service – Excluding Underwriting) under License No. GB24203860.
Please refer to the full risk disclosure mentioned on our website.