MU | Century Financial Limited

Introduction
Despite its perceived complexities, trading can become easy to understand for people willing to learn. This How to Trade series, in four weekly parts—Week 1, Week 2, Week 3, and Week 4—covers ideas and aspects for anyone who wants to become a trader.
Week two covers position sizing: the two numbers beginners routinely confuse—risk amount and position value—how to calculate how much to buy, why the stop level comes first, and what a run of consecutive losses actually costs. This could lead to a more definitive risk rule, set before any strategy exists.
Why Risk Comes Before Strategy
Most beginner material teaches chart patterns first and sizing somewhere near the end. That ordering feels natural, since strategy is the interesting part. It also makes strategy impossible to evaluate. A method winning 55% of its trades is excellent or ruinous depending entirely on what each loss costs relative to the account.
Without a sizing rule fixed in advance, a losing week tells you nothing. You cannot separate a flawed approach from a sound approach when you apply them with exaggerated position sizes.
The Two Numbers People Confuse
Risk amount is what you lose if the trade goes against you and the stop triggers. Position value is what the holding is worth in the market. Take a $2,000 account and a 1% risk rule, which is $20. A share trades at $50 with the stop at $48, meaning $2 of risk per share. Dividing $20 by $2 gives 10 shares, and 10 shares at $50 is a $500 position.
So risking 1% of the account means holding 25% of it in that position. Both statements are true at once. Someone expecting their $20 risk to mean a $20 position will size far too small. Someone treating the $500 as the risk will panic at an ordinary move.
Working Out the Size
Position size equals the risk amount divided by the stop distance, measured in the value of one unit of the instrument. Worked through on a currency pair: the same $2,000 account and 1% rule gives $20 of risk. The stop sits beyond the most recent swing low, which happens to be 25 pips away. On EUR/USD, one micro lot of 1,000 units is worth roughly $0.10 per pip. Dividing $20 by 25 pips gives $0.80 per pip of acceptable exposure, which comes to eight micro lots, or 0.08 lots.
Change any input and the output moves with it. Widening the stop to 50 pips halves the size to 0.04 lots for identical risk; a larger account raises it proportionally. These percentages are illustrative, not recommendations, and no universal figure exists.
Where the Stop Goes First
Notice the order in that calculation. Stop distance was an input, not something worked out afterwards.
The reverse order is common, and it inverts the logic entirely. Someone who decides to buy a fixed quantity, then places a stop wherever the loss feels bearable, has let the size determine the stop. The stop then sits at an arbitrary price with no relationship to anything on the chart.
Where Do Stops Commonly Sit?
Traders generally place them at levels where the original idea behind their trade would fail, rather than at an arbitrary comfortable distance.
- Beyond a recent swing high or low
- Outside a defined range boundary
- Past the level the entry was based on
- At a distance reflecting the instrument's normal range
What Ten Losses in a Row Costs
| Percentage of Loss | After 10 Losses | Recovery Required |
|---|---|---|
| 1% | Down 9.6% | 10.6% |
| 2% | Down 18.3% | 22.4% |
| 5% | Down 40.1% | 67.0% |
The right-hand column is the part worth sitting with. Losses and recoveries are not symmetric, and the gap widens sharply as risk per trade climbs.
A daily or weekly loss limit means that once you reach a defined drawdown, you stop for the day regardless of what the chart is showing. This rule exists to interrupt the impulse that follows a loss.
This Week's Output
By the end of week two, three things should exist in writing, before any strategy does.
A fixed percentage of the account that one trade can cost. A rule for where stops go, based on technicals and chart structure rather than comfort. And a point at which you stop for the session, no matter how appealing the next setup looks.
The Number the Calculation Needs
The sizing formula needs one figure that no chart displays: what a single unit of the instrument is actually worth. A pip on a currency pair, a point on an index and a cent on a share are different amounts of money, which is why a position size that feels sensible on one instrument can be badly wrong on another.
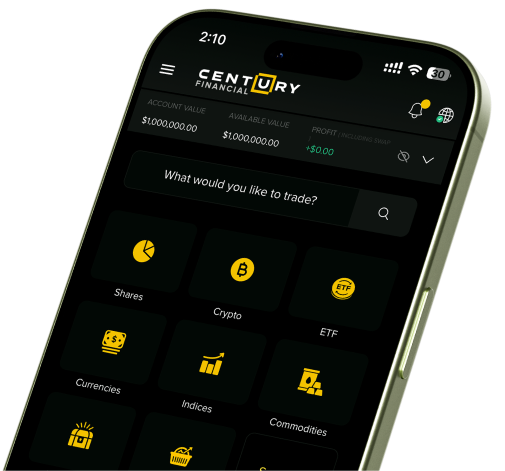
Century Financial carries currencies, indices, commodities and shares on one FSC-regulated account, which makes that divergence easy to see directly. With a demo account, run the same $20 of risk and the same stop distance across four instruments and you might discover 4 different effects. That difference is why the calculation exists.
Settle the Cost, Then Pick the Method
Position sizing may not be the exciting part of learning to trade, and placing it in week two rather than week four is deliberate. A strategy either works within that constraint or it does not, making the descision making a bit more straightforward. Without it, a good method sized badly and a poor method sized well produce the same-looking account curve.
Week three moves to charts, which could be where most people wanted to start. The difference is that it arrives with a sizing rule already in place, so every chart decision carries a defined consequence. Running the calculation on a few instruments until it stops feeling like arithmetic is this week's real work.
FAQs
The content in this blog, including any research, analysis, opinions, forecasts, or other information (collectively, "Information"), is provided by Century Financial Limited (the “Company”) for marketing, educational, and general informational purposes only. It should not be construed as investment advice, a recommendation, or a solicitation to buy or sell any financial instruments.
This Information may also be published across various channels, including Company’s website, third-party platforms, newsletters, marketing materials, emails, social media, messaging apps, webinars, and other communications. While the Company strives for accuracy, we do not guarantee the completeness, reliability, or timeliness of any content. Any decisions made based on this Information are at your own risk. The Company accepts no liability for any loss or damage arising from its use.
Trading in financial products involves significant risk and may not be suitable for all investors. Please ensure you fully understand the risks and seek independent professional advice if necessary.
The Company is licensed and regulated by the Financial Services Commission (FSC) of Mauritius as an Investment Dealer (Full Service – Excluding Underwriting) under License No. GB24203860.
Please refer to the full risk disclosure mentioned on our website.