MU | Century Financial Limited

Introduction
Bond yields get quoted constantly and explained rarely. They determine what governments pay to borrow, what companies pay for credit, what households pay on mortgages, and a meaningful share of what shares are worth. None of the machinery is complicated, but people tend to skip it, so most bond commentary arrives without a strong foundation to build on.
Basic Terms to Know
Five words carry most of the weight in any bond discussion.
Face Value
The amount the issuer repays when the bond matures, also called par. It does not change regardless of what the bond trades for in the secondary markets.
Coupon
The fixed annual payment the bond makes, set as a percentage of face value at issue. A 4% coupon on a $1,000 bond pays $40 every year, permanently.
Maturity
The date the issuer repays face value and the bond ceases to exist. Maturities range from a few weeks to fifty years, and the length matters enormously.
Yield
The return the bond produces relative to what it currently costs. Unlike the coupon, it moves constantly because the price moves constantly.
Duration
A measure of how much a bond's price moves when yields change. Longer maturities carry higher duration, meaning bigger price swings from the same rate move.
What Are Bonds?
A bond is a loan in tradable form. An issuer borrows money, agrees to pay interest on a schedule, and repays the principal at a set date. What makes it a market rather than a private arrangement is that the lender can sell the loan to someone else at any point.
Who Issues Them
Governments issue sovereign bonds, and those from stable economies carry the lowest default risk of any asset class. Companies issue corporate bonds, paying more to compensate for higher credit risk. Municipalities and agencies, too, issue their own varieties in between.
How Tenures Differ
Short-dated bonds of two years or less respond mainly to central bank policy and move relatively little in price. Intermediate maturities around five to ten years balance the two influences. Long-dated bonds of twenty to thirty years respond more to inflation expectations and long-run uncertainty than to any current policy setting.
One Bond, Many Prices
For example, a government issues a bond with a face value of $1,000 and a 4% coupon, paying $40 a year until maturity. The $40 never changes. What changes is what a buyer pays for that stream of payments once the bond trades on the secondary market.
| What a buyer pays | Annual coupon | Resulting yield |
|---|---|---|
| $1,100 | $40 | 3.64% |
| $1,000 | $40 | 4.00% |
| $900 | $40 | 4.44% |
| $800 | $40 | 5.00% |
- Returns change despite the coupon remaining the same
- Only the purchase price differs
- Yield rises as price falls, without exception
- Quoted yields differ slightly, since yield to maturity also counts the redemption gain
Yield-Price Relationship
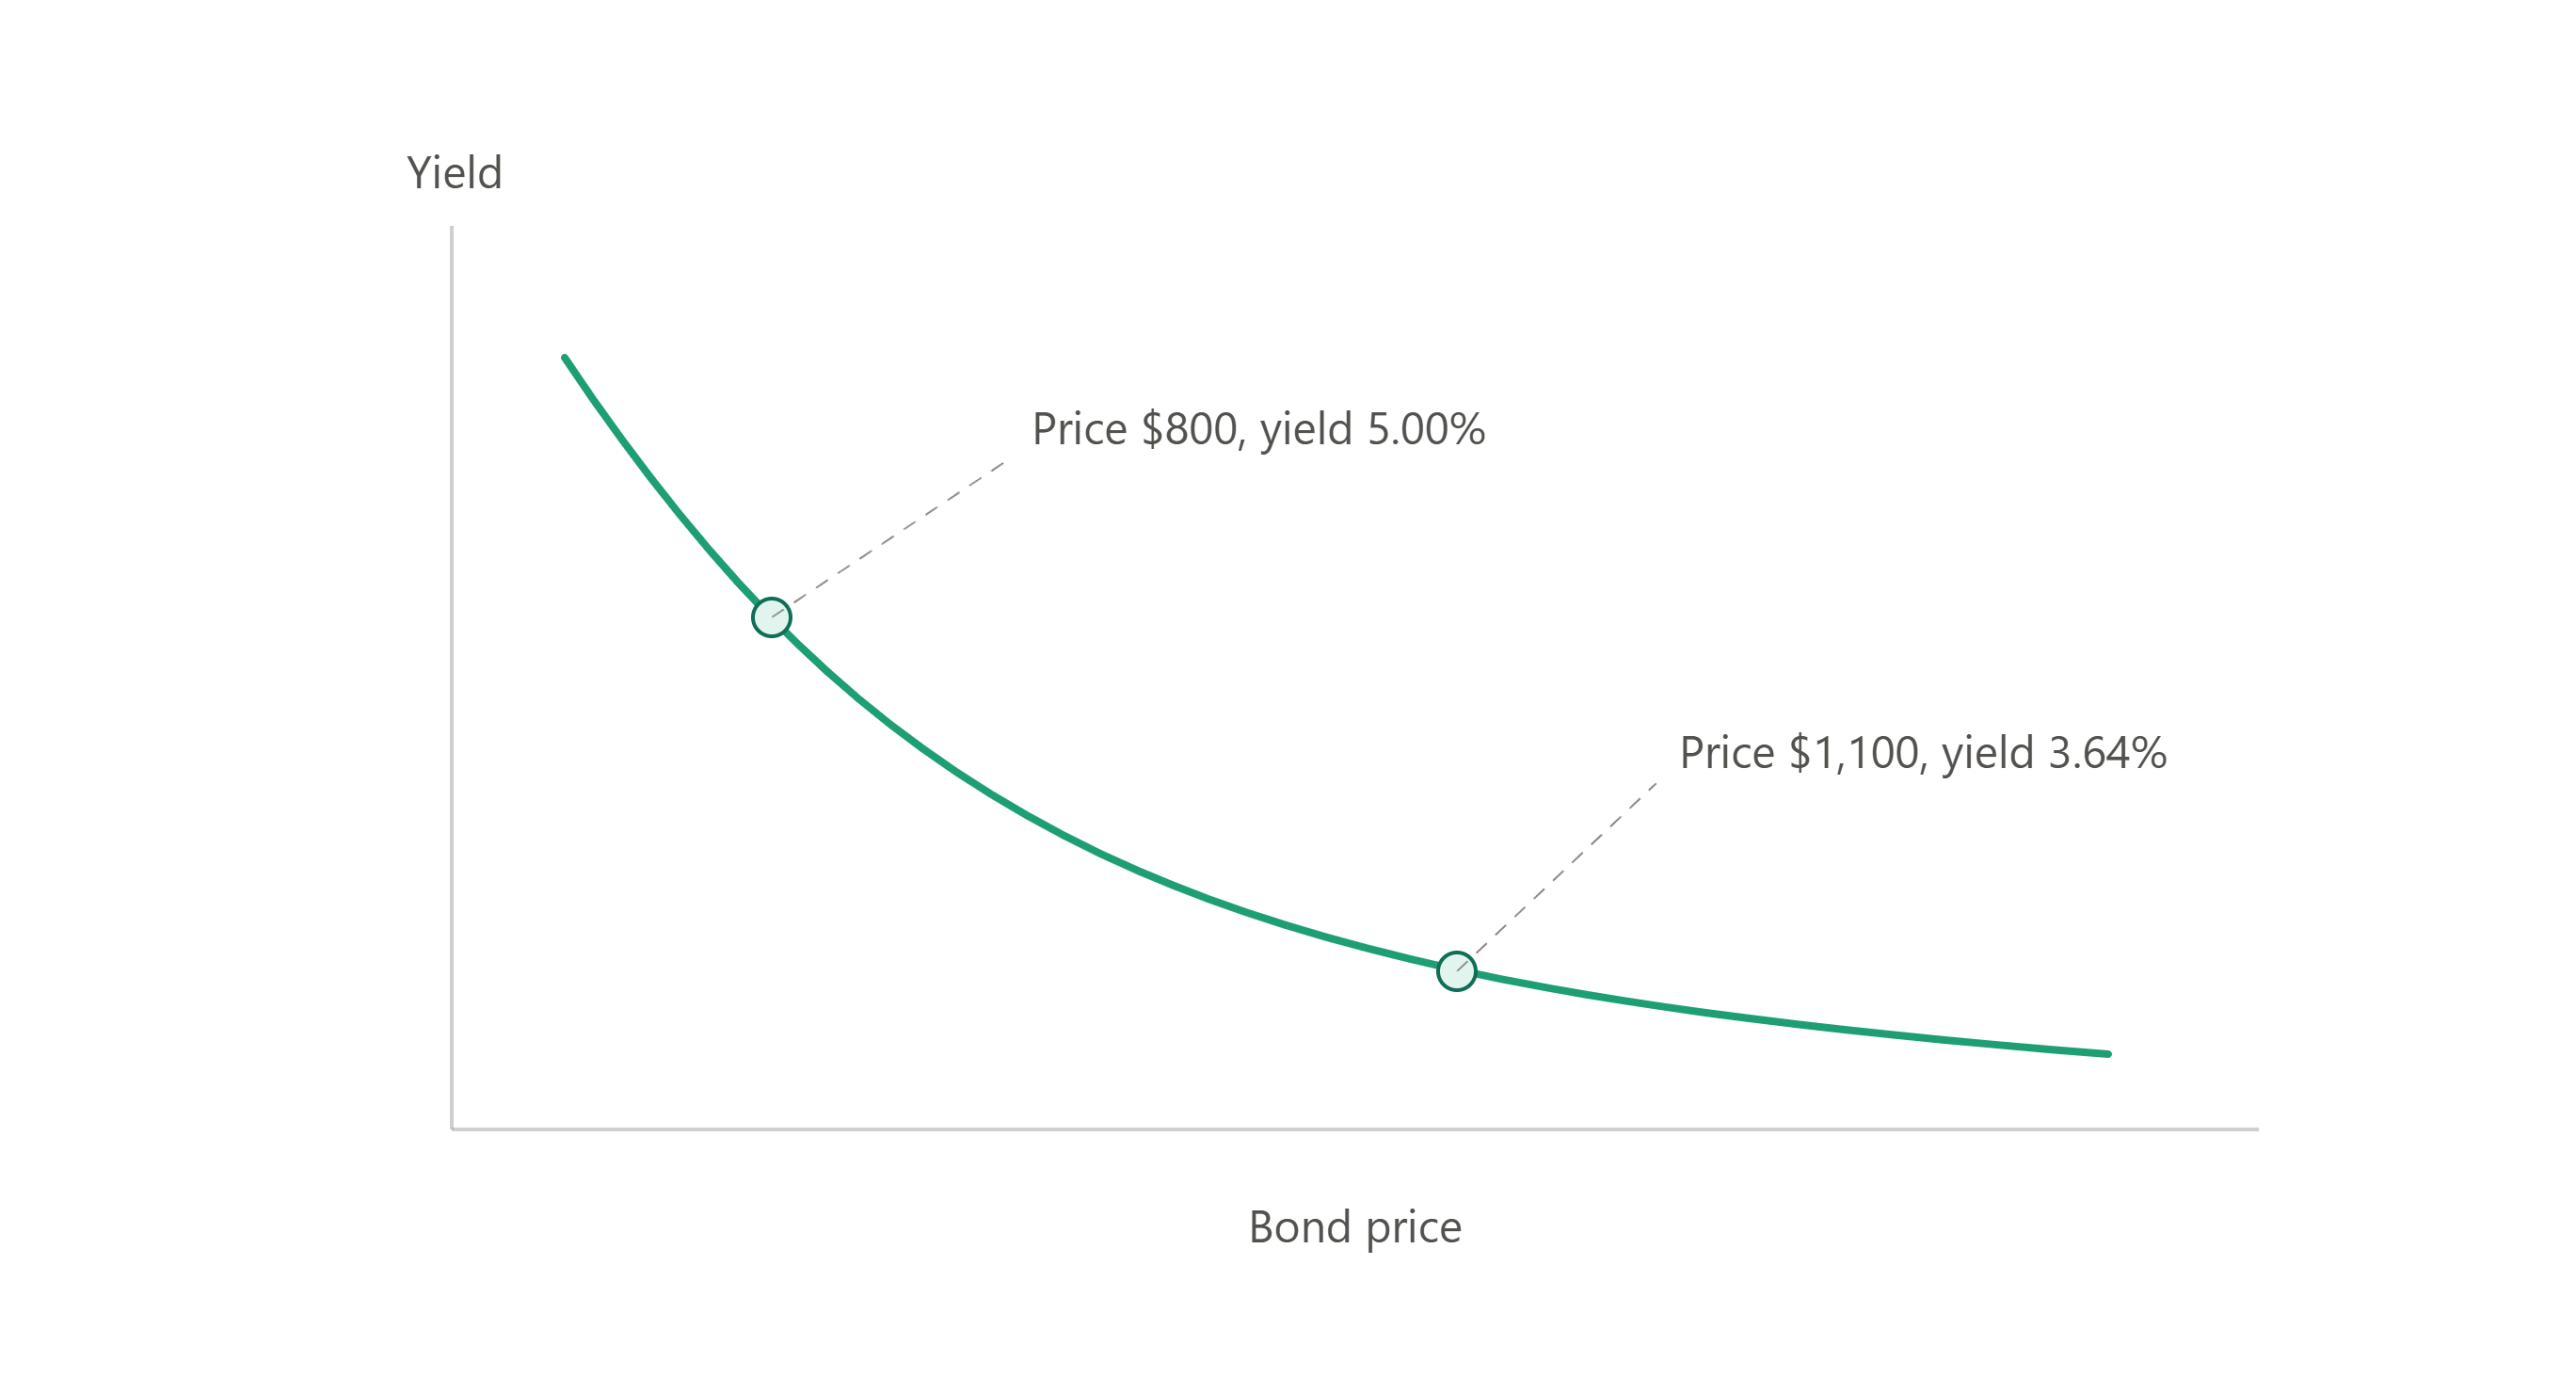
The practical consequence is that every headline about rising bond yields is also a headline about falling bond prices. The curve slopes down because it has no alternative. A fixed payment measured against a smaller price is a larger percentage, and measured against a larger price it is a smaller one. This is arithmetic rather than market behavior.
They describe the same event from opposite ends, and a reader who misses that might end up interpreting a bond selloff as good news.
What It Means When Yields Change
A yield move is a signal, but what it signals depends on the direction and the influences.
When Yields Rise
Rising yields often signal that investors want to pay less for existing bonds, so new borrowers must offer more. As a result, governments face higher debt-servicing costs, pushing mortgage rates up and making credit costlier. For equities, higher yields raise the return available from more secure assets, which makes future company earnings worth less today.
When Yields Fall
Bond prices rise, and yields fall when buyers pay more for existing bonds, typically because they expect lower rates ahead or want safety. Borrowing gets cheaper across the economy. Falling long yields can accompany confidence about inflation, or pessimism about growth, and the two look identical on a chart.
Factors Influencing Yield and How to Read Them
Several forces act on bond yields at once, often pulling in opposite directions.
- Central bank policy rates, which anchor the short end most directly
- Inflation expectations, since fixed payments lose value as prices rise
- Government borrowing volume, because more supply needs more buyers
- Credit quality, which determines the premium above sovereign rates
- Demand for safety, which lifts bond prices in market stress
Reading the Yield Curve
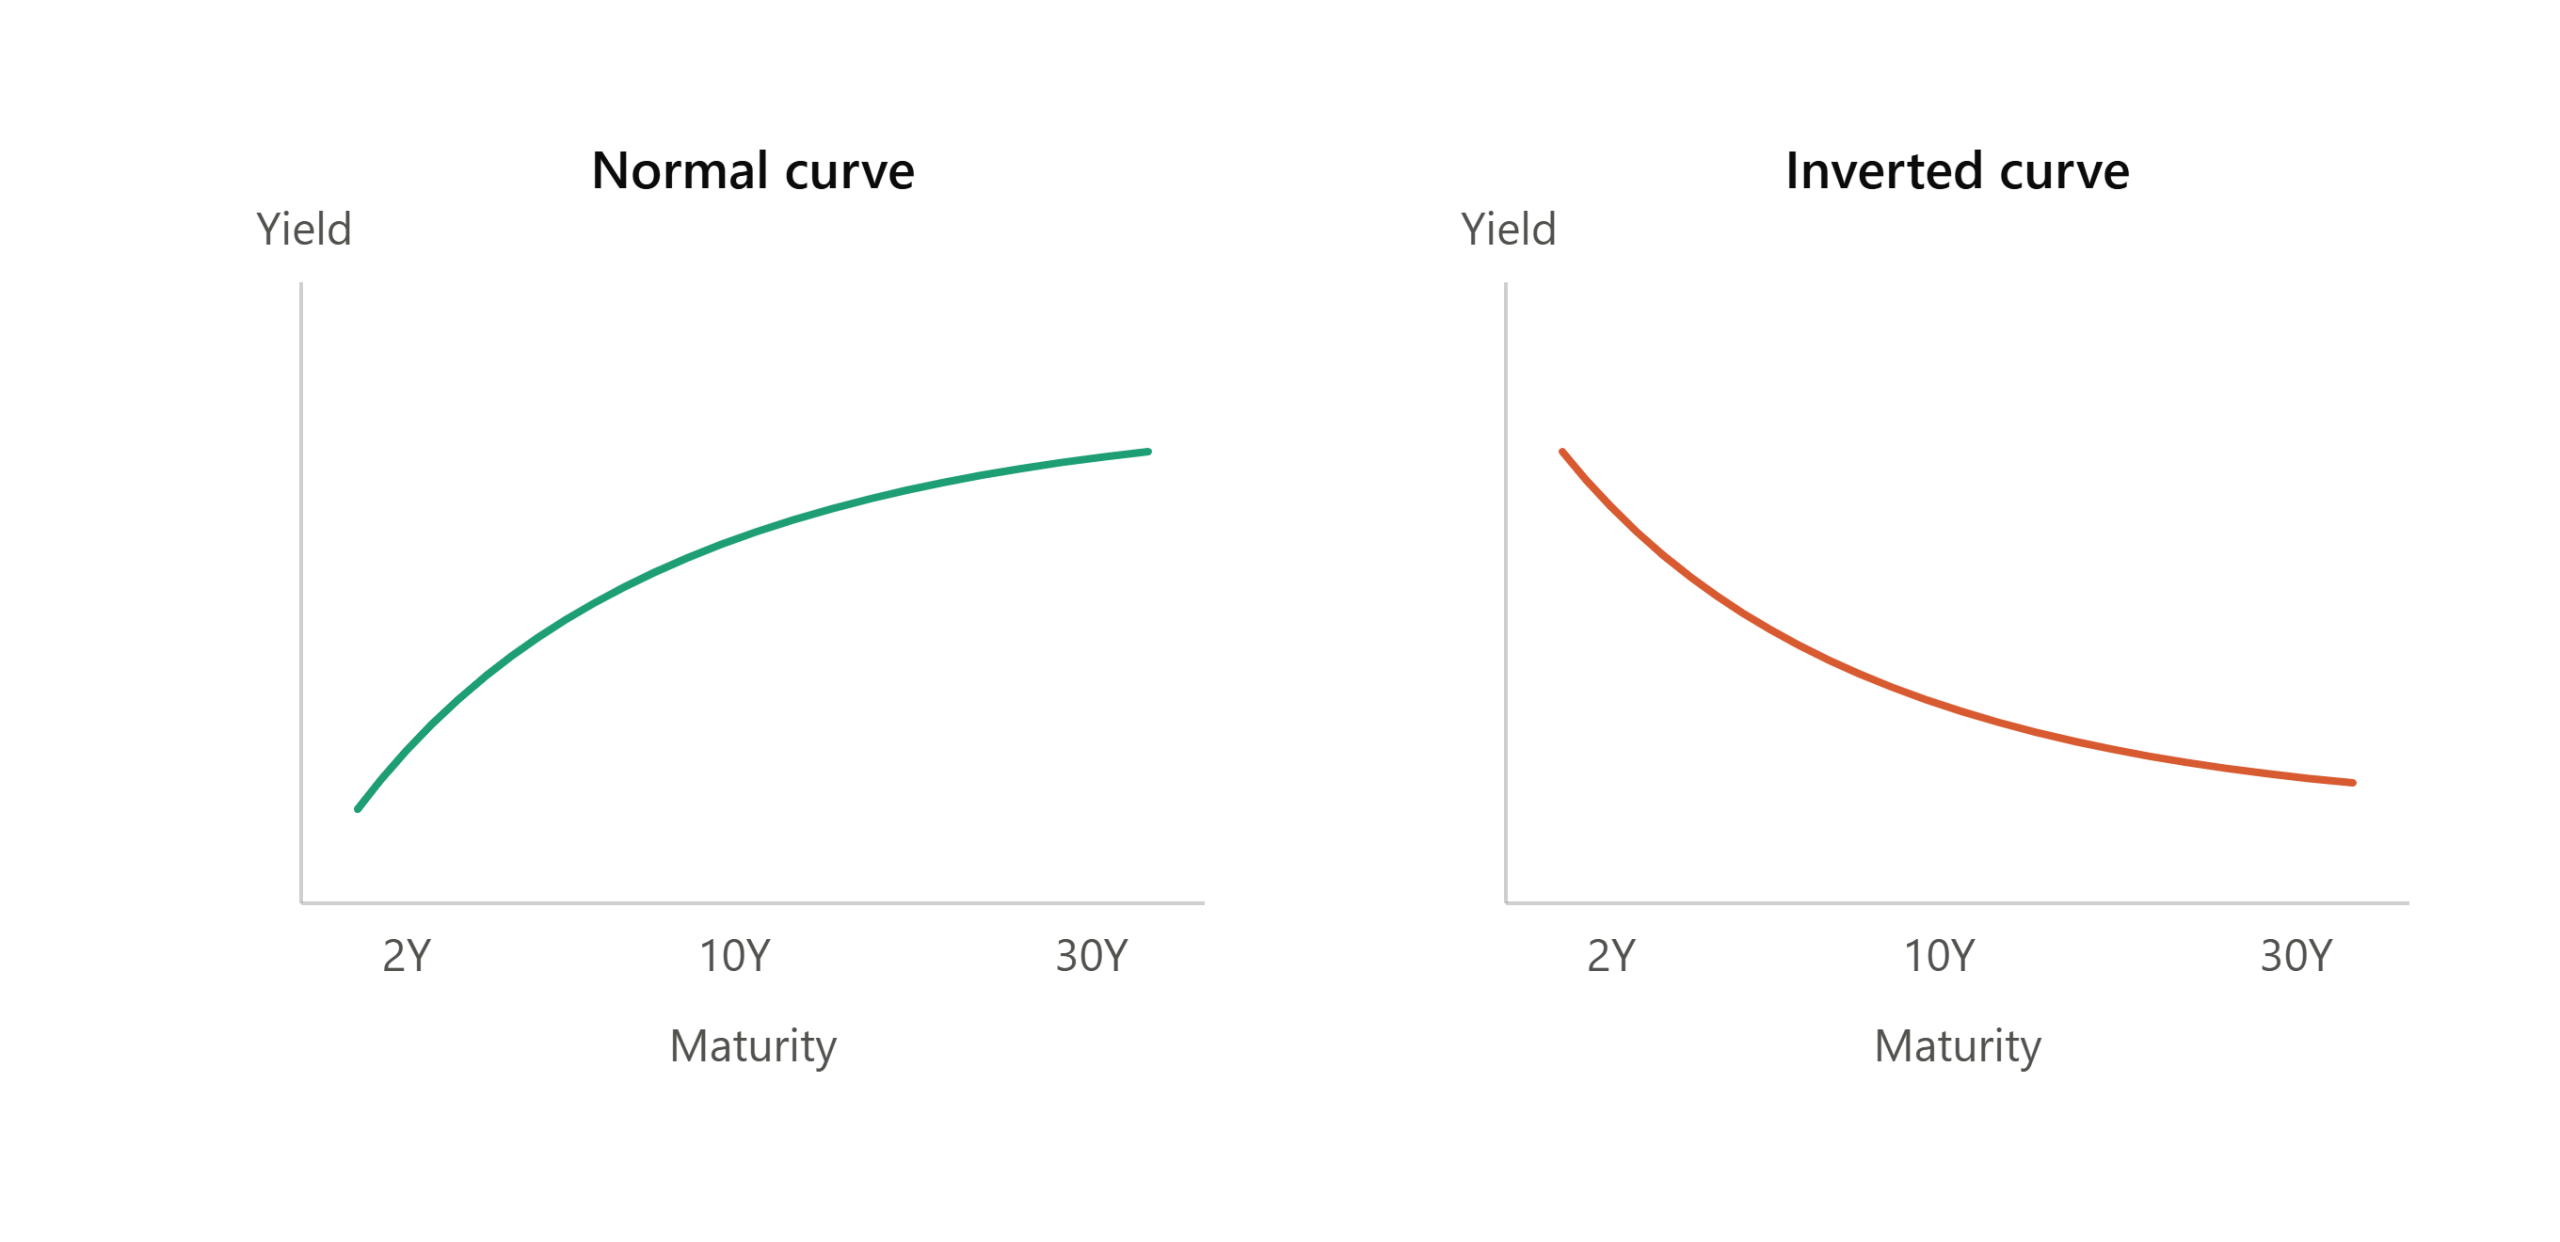
Plotting yields across every maturity produces the yield curve, and its shape says more than any single yield. The normal shape slopes upward, since lending for thirty years involves more unknowns than lending for two.
An inverted curve, where short yields exceed long ones, has historically tended to precede slowdowns, though lead times have varied from months to well over a year. The more useful habit is watching which end moves. Short yields track policy closely, and long yields answer to something else.
The Part That Isn't Expectation
A long-dated yield contains two separate components, and separating them changes what a yield move means.
What Term Premium Is
Suppose you are lending for ten years and you expect short-term rates to average 3% over that decade. You could lend for three months at a time and roll it over thirty-nine times, earning roughly that 3%. So a ten-year bond has to beat 3% before it is worth considering at all.
If the ten-year bond yields 4.2%, the extra 1.2 percentage points is term premium. It is what you are charging for giving up the ability to change your mind for ten years.
Why It Moves Independently
Term premium compensates for the width of possible outcomes, not for any particular forecast. An investor can believe the economy is perfectly healthy and still charge more for a thirty-year commitment, because thirty years contains more unknowns.
How to Separate the Two
Inflation-protected government bonds trade alongside conventional ones. The difference between their yields gives the market's expected inflation rate, called the breakeven. When a yield move shows up mostly in breakevens, the market often reads it as an inflation story. When it shows up in real yields instead, the explanation lies in term premium or in a genuine shift in what capital can earn elsewhere.
Why US Bond Yield Impacts the World
The US 10-year Treasury yield functions as the world's reference price for money. Mortgages, corporate debt, and sovereign bonds across dozens of countries price at a spread above it, which means a move in that single number reaches markets with no direct connection to American government borrowing.
For anyone holding equities, currencies, or gold, this makes the 10-year less a bond-market statistic and more an input into almost everything else they own.
A Tenured Supervision
Bonds teach that tenure changes a thing's nature. A two-year note and a thirty-year bond are similar instruments in structure but behave entirely differently.
The same logic applies to institutions. Century Financial has operated for more than 35 years, across rate cycles that ran from near zero to double digits and back. Treasuries sit on the same account as shares, indices, currencies, and commodities through the Century Trader App and MT5, regulated by the Financial Services Commission (FSC) in Mauritius. Trading therefore is done securely through regulated platforms with multilingual 24x5 support.
Reading the Future
Bond yields are a market's attempt to price time itself. Prices and yields are two views of one number. The curve's shape sketches what investors expect across decades.
When long yields jump, and the coverage reaches for a central bank explanation, ask whether the move landed in breakevens or real yields, because those are different stories with different consequences. The data to answer it is published daily, free, by the issuing governments themselves. If the final question is which platform is right to act on these insights, Century Financial provides secure access to global markets through award-winning, intuitive platforms, with demo options to test strategies before committing real capital.
FAQs
Disclaimer: CFDs are complex instruments and come with a high risk of losing money rapidly due to leverage. 74–89% of retail investor accounts lose money when trading CFDs. You should consider whether you understand how CFDs work and whether you can afford to take the high risk of losing your money. Past performance is not indicative of future results. This content is for informational purposes only and does not constitute investment advice or a recommendation to buy, sell, or hold any financial instrument. Century Financial does not guarantee the accuracy, completeness, or timeliness of this information and accepts no liability for any loss arising from its use.