MU | Century Financial Limited

Introduction
Most advice about chart mistakes focuses on interpretation, as though the problem always lies in misreading the picture. Often, the problem starts earlier. The chart is showing something slightly different from what the trader assumes, and every conclusion drawn afterward inherits the error.
Five Errors Worth Checking For
Mistake 1: Stacking Indicators That Measure the Same Thing
Adding a third indicator feels like adding a third opinion. Often it is the same opinion restated, because many popular indicators belong to the same family and respond to the same input.
- RSI, Stochastic, and CCI all track momentum
- Agreement between them confirms very little
- Different families measure genuinely different things
| Family | What It Measures | Examples |
|---|---|---|
| Momentum | Speed of price change | RSI, Stochastic, CCI |
| Trend | Direction and persistence | Moving averages, MACD, ADX |
| Volatility | Range expansion | Bollinger Bands, ATR |
Mistake 2: Assuming a Daily Candle Is Universal
Charts often carry the broker's server timestamp, not local time, and that clock is not standardized across the industry. Two traders comparing the same instrument can be looking at differently bounded candles.
- Most brokers use GMT+2, shifting to GMT+3 seasonally
- That setting produces five daily candles per week
- GMT+0 servers produce six, including a partial Sunday bar
The extra partial candle affects any indicator calculated across daily bars, including average true range. Demo and live servers from the same firm can also differ.
Mistake 3: Reading Tick Volume as Real Volume
Volume on a currency chart is rarely traded volume. Because foreign exchange is decentralized, most platforms display tick volume, which counts price updates rather than contracts changing hands.
- Tick volume counts quote changes, not size
- Figures show one broker/data provider's feed only
- Equity and futures charts do show traded volume
Mistake 4: Recognizing Patterns Only in Hindsight
Completed patterns are obvious on a historical chart because the outcome is already visible. The same formation looks ambiguous mid-development, and most candidates never complete.
- Historical charts hide all failed setups
- Patterns look cleaner after the fact
- Forward testing reveals the actual completion rate
Mistake 5: Using Linear Scale on Long Horizons
On a linear axis, a move from 100 to 110 occupies the same vertical distance as one from 1,000 to 1,010, though the first is a 10% change and the second is 1%.
- Linear scale distorts long-term percentage moves
- Logarithmic scale spaces equal percentage changes equally
- Trendlines can shift meaningfully between the two
Where the Chart Settings Actually Live
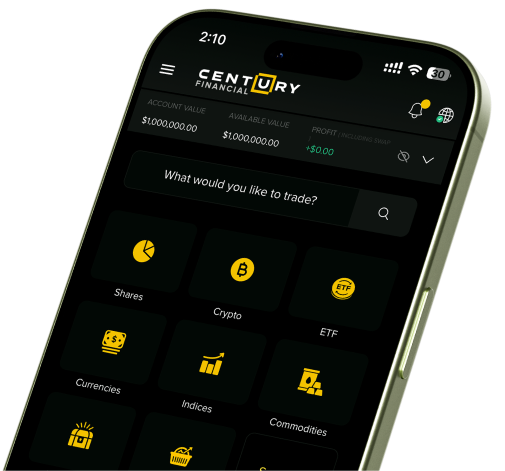
These are settings questions as much as skill questions, so the platform is part of the answer. Several platforms like MT5 display server time in the Market Watch window, support logarithmic scaling on any chart, and distinguish tick volume from real volume where the exchange provides it. Century Trader provides the same on the go.
Century Financial takes an education-first approach, has more than 35 years in the market, is regulated by the Financial Services Commission (FSC) in Mauritius, and offers multilingual support to make trading more transparent.
Check the Instrument Before the Interpretation
None of these five are sophisticated errors. They are assumptions that go unexamined because a chart looks like an objective picture of the market rather than a rendering determined by feed, clock, and scale. Each is a small thing that quietly alters conclusions built on top of it.
The practical response takes about twenty minutes. Open the platform, find the server time, check what your volume field is actually counting, switch a long-horizon chart to logarithmic scale, and see whether your trendlines survive. Whatever that exercise turns up is worth knowing before the next setup rather than after it. With platforms and support that serve you around the clock, Century Financial makes trading and analysis more approachable.
FAQs
The content in this blog, including any research, analysis, opinions, forecasts, or other information (collectively, "Information"), is provided by Century Financial Limited (the “Company”) for marketing, educational, and general informational purposes only. It should not be construed as investment advice, a recommendation, or a solicitation to buy or sell any financial instruments.
This Information may also be published across various channels, including Company’s website, third-party platforms, newsletters, marketing materials, emails, social media, messaging apps, webinars, and other communications. While the Company strives for accuracy, we do not guarantee the completeness, reliability, or timeliness of any content. Any decisions made based on this Information are at your own risk. The Company accepts no liability for any loss or damage arising from its use.
Trading in financial products involves significant risk and may not be suitable for all investors. Please ensure you fully understand the risks and seek independent professional advice if necessary.
The Company is licensed and regulated by the Financial Services Commission (FSC) of Mauritius as an Investment Dealer (Full Service – Excluding Underwriting) under License No. GB24203860.
Please refer to the full risk disclosure mentioned on our website.