MU | Century Financial Limited

Introduction
Gold is often held rather than traded, leaving much of its behavior unexamined. It moves on a defined set of drivers, trades nearly around the clock, and behaves differently at different hours. The gold trading strategies below are frameworks traders use to organize their behavior, each resting on a different assumption about what gold responds to.
Why Gold Suits More Than One Approach
Gold sits at an unusual intersection. It is a commodity, a currency proxy, and a reserve asset simultaneously, which means it responds to interest rate expectations, dollar strength, central bank activity, and international conditions in varying proportions.
That breadth is why several different approaches can work on the same instrument. It is also why any single framework will have periods where it stops describing what the market is doing.
Five Frameworks Traders Use
1. Moving Average Trend Following
This system uses the 50-day and 200-day moving averages to identify sustained directional moves. The shorter average crossing above the longer is known as a golden cross, and the reverse as a death cross. Both are lagging indicators, confirming movement that has already begun rather than anticipating it.
- Daily charts, multi-week holding horizons
- Pullbacks often preferred over crossover entries
- Stops commonly trailed beneath the rising average
2. Range Breakouts
After a large move, gold frequently consolidates within a defined band, creating visible support and resistance levels. This approach treats the band as stored energy and waits for a clear close beyond it.
- Daily and four-hour consolidation phases
- Retest of the broken level used as confirmation
- Range height gauges the expected move size
3. The Asian Session Range
Gold typically trades in a tighter band during Asian hours before volume expands at the London open. That quiet window falls within the working day in countries like Pakistan.
- Hourly charts or lower, intraday only
- Asian high and low marked before London
- Widening spreads at the open affect execution
4. Gold Versus the Dollar
Gold is priced internationally in dollars, so dollar strength and gold price have historically moved in opposite directions. World Gold Council research places the correlation at roughly -0.5 to -0.8, depending on the period measured.
- DXY direction checked alongside the gold setup
- Rolling correlation watched for a weakening relationship
- Both can rise together during liquidity stress
5. Scheduled Macro Releases
Gold responds sharply to interest rate decisions and inflation data, because these change the opportunity cost of holding an asset that pays no yield. Positioning ahead of a release and standing aside through it are both recognized as models.
- Fed decisions, CPI prints, central bank commentary
- Execution risk rises regardless of direction taken
- Volatility can reverse within minutes of release
Strategies at a Glance
| Framework | Typical Timeframe | Core Assumption | Main Failure Mode |
|---|---|---|---|
| MA trend following | Daily, multi-week | Trends persist | Choppy, rangebound markets |
| Range breakouts | Daily and 4-hour | Consolidation precedes expansion | False breakouts |
| Asian session range | Intraday, hourly or lower | Quiet range sets a boundary | News-driven gaps |
| Gold against the dollar | Varies | Inverse correlation holds | Correlation breakdown |
| Macro releases | Event-driven | Reaction is tradeable | Spread widening, slippage |
What Matters More Than the Framework
None of these produce reliable signals on their own. They are ways of organizing observations, and each carries conditions under which it stops working, which is why the failure mode column mentioned above is arguably more useful than the assumption column.
Gold's volatility also makes sizing less transferable than traders expect. Position size and predefined exit levels govern outcomes more consistently than framework selection does. A carefully selected setup sized too large can end an account, while a mediocre setup sized appropriately usually cannot.
Tools That Support the Analysis
Every framework here depends on the same practical thing: being able to see the setup and act on it in the same place. The 50- and 200-day averages need to be plotted on the same chart. The Asian range needs to be marked before London opens, not after. A DXY reading is only a useful filter if it is visible next to the gold chart rather than in another tab.
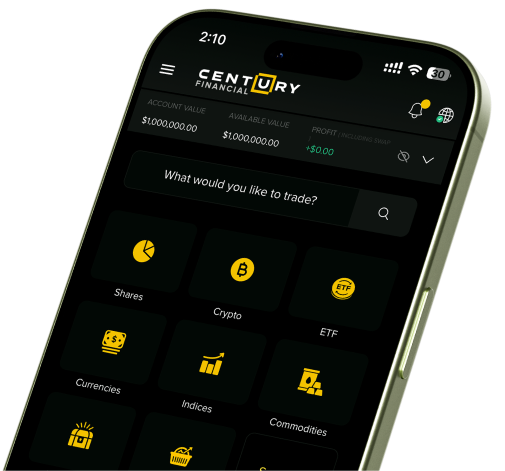
Century Financial has operated through more than 35 market cycles and is regulated by the Financial Services Commission (FSC) in Mauritius. Gold sits alongside shares, indices, currencies, other commodities, ETFs, and treasuries on the Century Trader App and MT5, both of which carry the charting and indicator tools these setups rely on.
Frameworks, Not Formulas
The five approaches here look at gold through different lenses: trend, structure, session, correlation, and event. None is more legitimate than the others, and none works in all conditions. What separates them is what each one assumes, which is also what tells you when to expect it to underperform.
Applying any of this requires a platform where analysis and execution sit in the same place. Century Financial brings intuitive platforms providing charting, indicators, and access to gold and global markets. If you are testing an approach, a demo account is a reasonable place to start.
FAQs
Disclaimer: CFDs are complex instruments and come with a high risk of losing money rapidly due to leverage. 74–89% of retail investor accounts lose money when trading CFDs. You should consider whether you understand how CFDs work and whether you can afford to take the high risk of losing your money. Past performance is not indicative of future results. This content is for informational purposes only and does not constitute investment advice or a recommendation to buy, sell, or hold any financial instrument. Century Financial does not guarantee the accuracy, completeness, or timeliness of this information and accepts no liability for any loss arising from its use.